GIS Programming and Web Map Development Projects
Food Pantry Site Suitability Analysis Tool
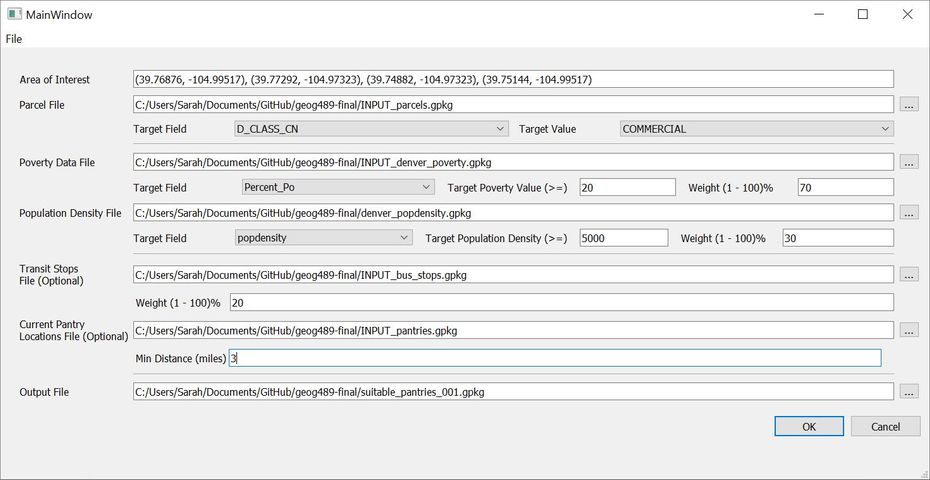
As a final project for GEOG 489, Advanced Python Programming for GIS, I created a standalone QGIS tool using PyQt5 and the QGIS API that determines optimal locations for a community pantry. You can download the script and demo files here.
The application takes parcel, demographic, transportation, and existing pantry data sets as inputs, allows the user to adjust data weights, and outputs a GPKG with parcels ranked for pantry suitability. This spatial analysis workflow processes datasets in memory and includes spatial clipping, coordinate reprojection, buffer analysis, proximity scoring, attribute filtering, and multi-factor suitability modeling.
In future versions I would like to break the main processing function into smaller components, make analysis logic independent of UI, allow users to adjust suitability values (which are currently hard-coded), and incorporate more robust error-handling.
Please watch the video below for a full walk through.
more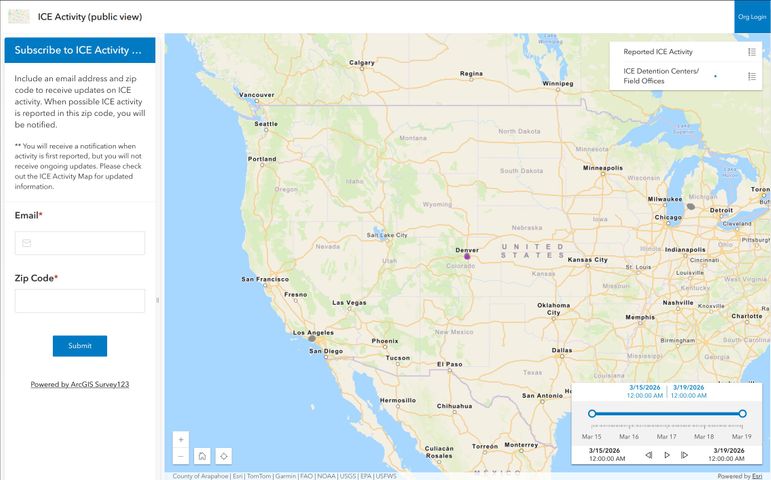
Neighborhood Safety Public Web Map
For my final project for GEOG 863, Web Application Development for Geospatial Professionals, I created two web maps that allow civilians and organizations to track and report ICE encounters in real time.
I created these maps using ArcGIS online, ArcGIS Maps SDK for JavaScript Web Components, ArcGIS Survey, Javascript, HTML, CSS, and Make.com (for webhooks and email alerts).
Future improvements to this web app would focus on security, since the data reported and collected via these maps is highly sensitive. For the purpose of the assignment, I used ArcGIS online and currently have email addresses collected via form submissions stored in Google Sheets. I'd like to recreate this app using free and open source alternatives that would prioritize encryption of sensitive data and make organization login more secure and verifiable.
You can view the code for public web map here.
more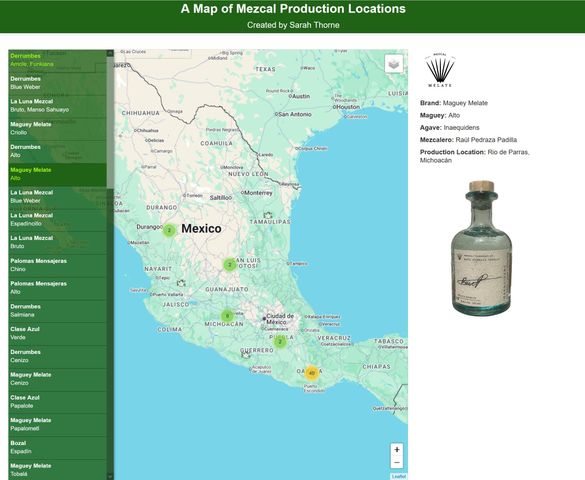
Mezcal Data Web Map
For my final project for GEOG 585, Open Web Mapping, I created a web map that shows where mezcals are produced.
Mezcal is growing in popularity in the US, and as a bartender at a mezcal bar I get asked “is mezcal from Mexico or is it produced here?” quite often. To be labeled “mezcal”, the spirit must be produced within one of nine specific states in Mexico: Oaxaca, Durango, Guerrero, Guanajuato, Michoacán, Puebla, San Luis Potosí, Tamaulipas, and Zacatecas. Listing the town of production, the person who made the batch, and the type of agave used on the bottle label is unique within the world of liquor. Including this information ties into the handcrafted nature of mezcal and serves as a way to honor those who made it, but it also helps mezcal drinkers identify specific bottles and batches. I thought making a map of where various mezcals come from would help provide some spatial context to mezcal fans and newcomers alike.
After collecting my data and learning how to utilize Leaflet, I decided to serve my data as a GeoJSON to be drawn by the browser. Given that all my data geometries are points and there are fewer than 100 points, serving this layer as WMS did not seem necessary. The browser could handle reading all the data and attributes in the GeoJSON quickly enough, and this way the end user could view details about each data point without having to make additional requests to the server. I also wanted to explore the interactivity and customizable plugin options that were available with Leaflet.
more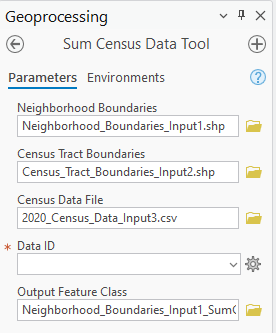
Census Data Aggregation Tool
For my final project for GEOG 485, GIS Programming and Software Development, I created a spatial aggregation tool, which takes data from smaller areas (census tracts) and sums it into larger neighborhood tracts. The output is a new feature class of neighborhood boundaries with an added field that provides the data sum for each neighborhood.
Future improvements would allow the user to select multiple (or all) data fields to be calculated for each neighborhood, and add these to the neighborhood boundaries feature class within a single run of the tool.
This tool could be used to sum data from any feature class with smaller polygons that have their center within larger polygons from a separate feature class.
You can view the code here.
more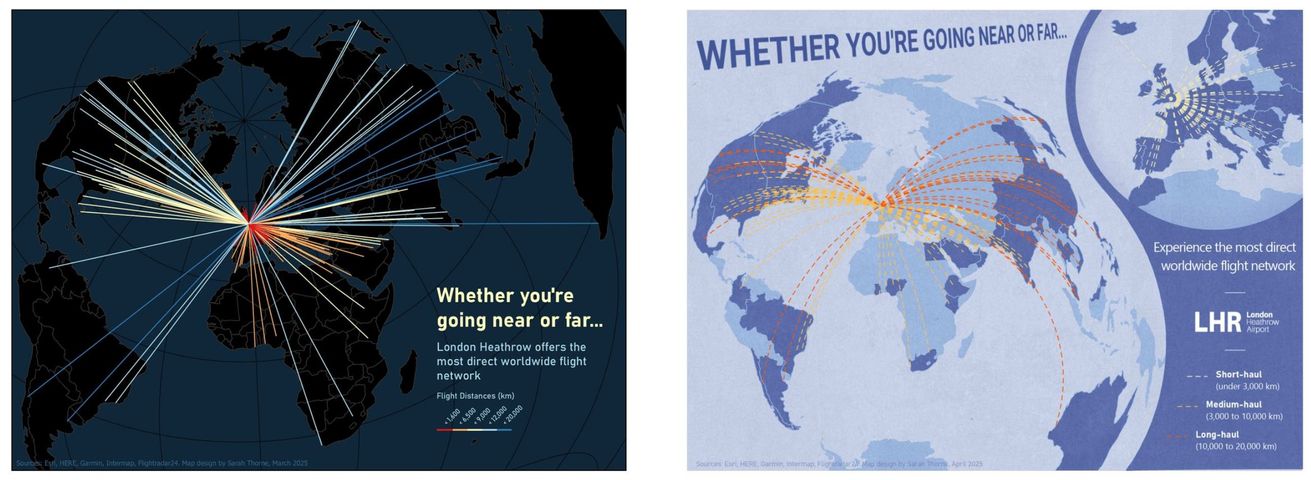
Flight Advertisement Map Revisions
For my final project in GEOG 486, Cartography and Visualization, I chose to revise an earlier assignment, which had the following objectives:
- Create three advertisements for London Heathrow Airport (LHR) using flight origin-destination data.
- Select and customize map projections based on each map’s purpose and overall design.
- Use appropriate visual variables to symbolize background data and flowlines.
- Create well-designed layouts with appropriate legends and text elements.
The first time I designed these maps I didn’t keep a consistent audience in mind. Initial maps symbolized excessive information, and the chosen color scheme did not support the maps’ intended purpose. During redesigning the maps, my approach focused on simplifying map symbolization and making sure my color schemes made sense for the data being portrayed.
more